Redistricting Update: Comparing the General Assembly’s Redraws with Competing Proposals

Bringing a wide array of experience from years working in and around state politics, NC Chamber Political Manager Kirk O’Steen leads the Chamber’s electioneering operations and advises our members on political trends and the state of North Carolina’s dynamic and ever-evolving electoral landscape.
*This update was originally posted on Tuesday, Feb. 22; it was updated on Wednesday, Feb. 23 to reflect new developments.

On Thursday, Feb. 17, members of the NC General Assembly voted to approve a new set of congressional and state legislative voting maps for North Carolina. The new maps were needed because previous developments in Harper v. Hall, the well-publicized case concerning the issue of redistricting and alleged gerrymandering following the 2020 census, had resulted in the General Assembly’s first set of maps being thrown out and legislators tasked with drawing a new set of maps in a matter of days. Not long after their approval, those maps faced a new test from the state’s judiciary in.
On Wednesday, Feb. 23, three North Carolina Superior Court judges, with the assistance of three retired judges appointed to serve as special masters, ruled on the final maps to be used in the state’s upcoming elections. While the judges accepted the General Assembly’s proposed maps for NC House and NC Senate, they tasked a group of outside experts to draw up a U.S. House district map which differed considerably from the version submitted by legislators. Also flavoring the judges’ decision were other maps submitted by various plaintiffs groups in the case.
Ahead of that decision by the three-judge panel, I offered NC Chamber members the following analysis of the competing proposals’ expected impacts on North Carolina’s electoral landscape. Though the congressional map approved by our state’s judiciary no longer matches the map proposed by the General Assembly on Feb. 17, this analysis still provides useful insight into how legislators approached this redraw. We begin by comparing the projected partisan breakdown of the General Assembly’s redrawn maps with the maps first approved by the same body last November.
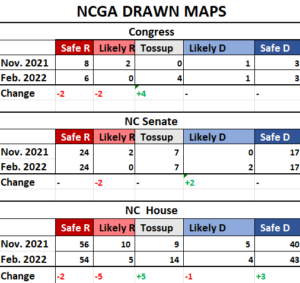
First, let’s give credit where credit is due – my comparisons were supported by free software available from Dave’s Redistricting and shape files available publicly online. To calculate which districts fell into which categories – Safe Republican, Likely Republican, Tossup, Likely Democratic, or Safe Democratic – I subtracted each district’s Democratic vote percentage from its Republican vote percentage to derive a generic vote differential. Districts with differentials greater than 10 percent were deemed “safe” for the party with the higher percentage of the vote; differentials from 5 percent to 10 percent designated a district as “likely” for the higher vote-getter; and differentials less than 5 percent were deemed “tossup” districts.
With that in mind, a quick glance at the image above should tell you one thing right off the bat: The General Assembly’s maps showed a strong trend toward more tossups and competitive-for-Democrat districts compared to the maps they approved last November – which holds true both for State House and Senate and for U.S. House districts.
In other words, it is safe to say the legislature provided a more competitive set of maps the second time around. Now, let’s look at how the General Assembly’s second set of proposed maps compared to those submitted by other groups.
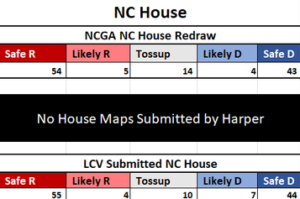
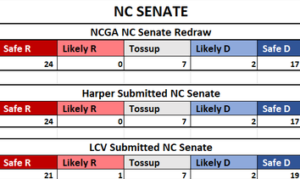
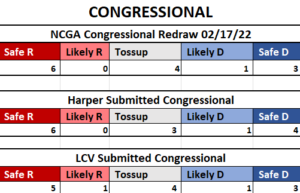
One set of competing maps for U.S. House and NC Senate came from a group of voters who had challenged the General Assembly’s original November maps in court, represented by Rebecca Harper, a voter who has been involved in previous redistricting lawsuits against the legislature. Another series of proposals included maps for U.S. House and both chambers of the state legislature, submitted by the NC League of Conservation Voters. The League of Conservation Voters’ maps were identical to their maps previously submitted to the courts before the trial.
When I calculate the projected partisan leans of the districts comprising these competing proposals using the formula above and then look at the results in aggregate, I do not see maps showing wildly different partisan breakdowns. Rather, the General Assembly’s maps seem largely to line up with maps proposed by other groups when it comes to the partisan breakdown they would be expected to yield for North Carolina’s 120 State House, 50 State Senate, and 14 U.S. House seats.
I think this is important to note given the contentious rhetoric surrounding the redistricting process. Constitutionally speaking, it is the responsibility and the authority of the legislative branch to carry out redistricting. Despite a somewhat vague charge from the State Supreme Court and an extremely condensed timeline, the legislature delivered what the courts asked for when drawing new maps – more competitive races across the board.
To learn more about the General Assembly’s proposed maps and the mapmaking process, visit the Legislative and Congressional Redistricting portal on the General Assembly’s website.
Sincerely,
Kirk O’Steen
Political Manager
NC Chamber